Introduction
If you have ever worked with EVM-based blockchains, you have almost certainly encountered a failed transaction with nothing more than a cryptic "execution reverted" message. Understanding why a transaction reverted, or behaved unexpectedly, often requires digging into the raw execution trace, stepping through hundreds of opcodes, and correlating stack values with storage changes. Most existing tools are either locked behind paid plans, restricted to Ethereum mainnet, or lack the granularity needed for serious debugging.
That is why we built Apollo, a free, web-based EVM transaction debugger that works on any EVM-compatible chain. In this post, we will walk you through what Apollo can do and how it can save you hours of debugging time.
The Problem with EVM Debugging
The Ethereum Virtual Machine is a stack-based execution environment. When a smart contract executes, it processes a sequence of low-level instructions called opcodes: PUSH, SLOAD, CALL, REVERT, and about 140 others. Each opcode manipulates a stack, reads or writes to memory and storage, and consumes gas.
When something goes wrong, the information available to you is minimal:
- Failed transactions typically show a
REVERT status with no further explanation unless the contract explicitly includes revert reason strings. - Unexpected behavior (wrong return value, incorrect state change) is invisible at the transaction level, you need to look inside the execution.
- Gas inefficiencies are impossible to diagnose without instruction-level profiling.
Traditional approaches involve running a local fork, adding console.log statements to Solidity code, or using debug_traceTransaction RPC calls and reading raw JSON traces. These are slow, cumbersome, and impractical for transactions that have already been mined on a live network.
What is Apollo?
Apollo is an EVM transaction debugger that reconstructs the full execution trace of any transaction and lets you explore it interactively. It is:
- Free to use: no account, no API key, no subscription.
- Chain-agnostic: works with any EVM-compatible network (Ethereum, Etherlink, Polygon, Arbitrum, Optimism, and any chain that exposes a standard RPC endpoint).
- Fully web-based: nothing to install. Just open app.apollotrace.com in your browser.
The workflow is straightforward:
- Input your transaction hash and the RPC URL of the network.
- Apollo reconstructs the complete execution trace and displays full transaction context: destination address, transaction hash, gas used, gas limit, and call depth.
- You step through opcodes one by one, inspecting the full EVM state at every point.
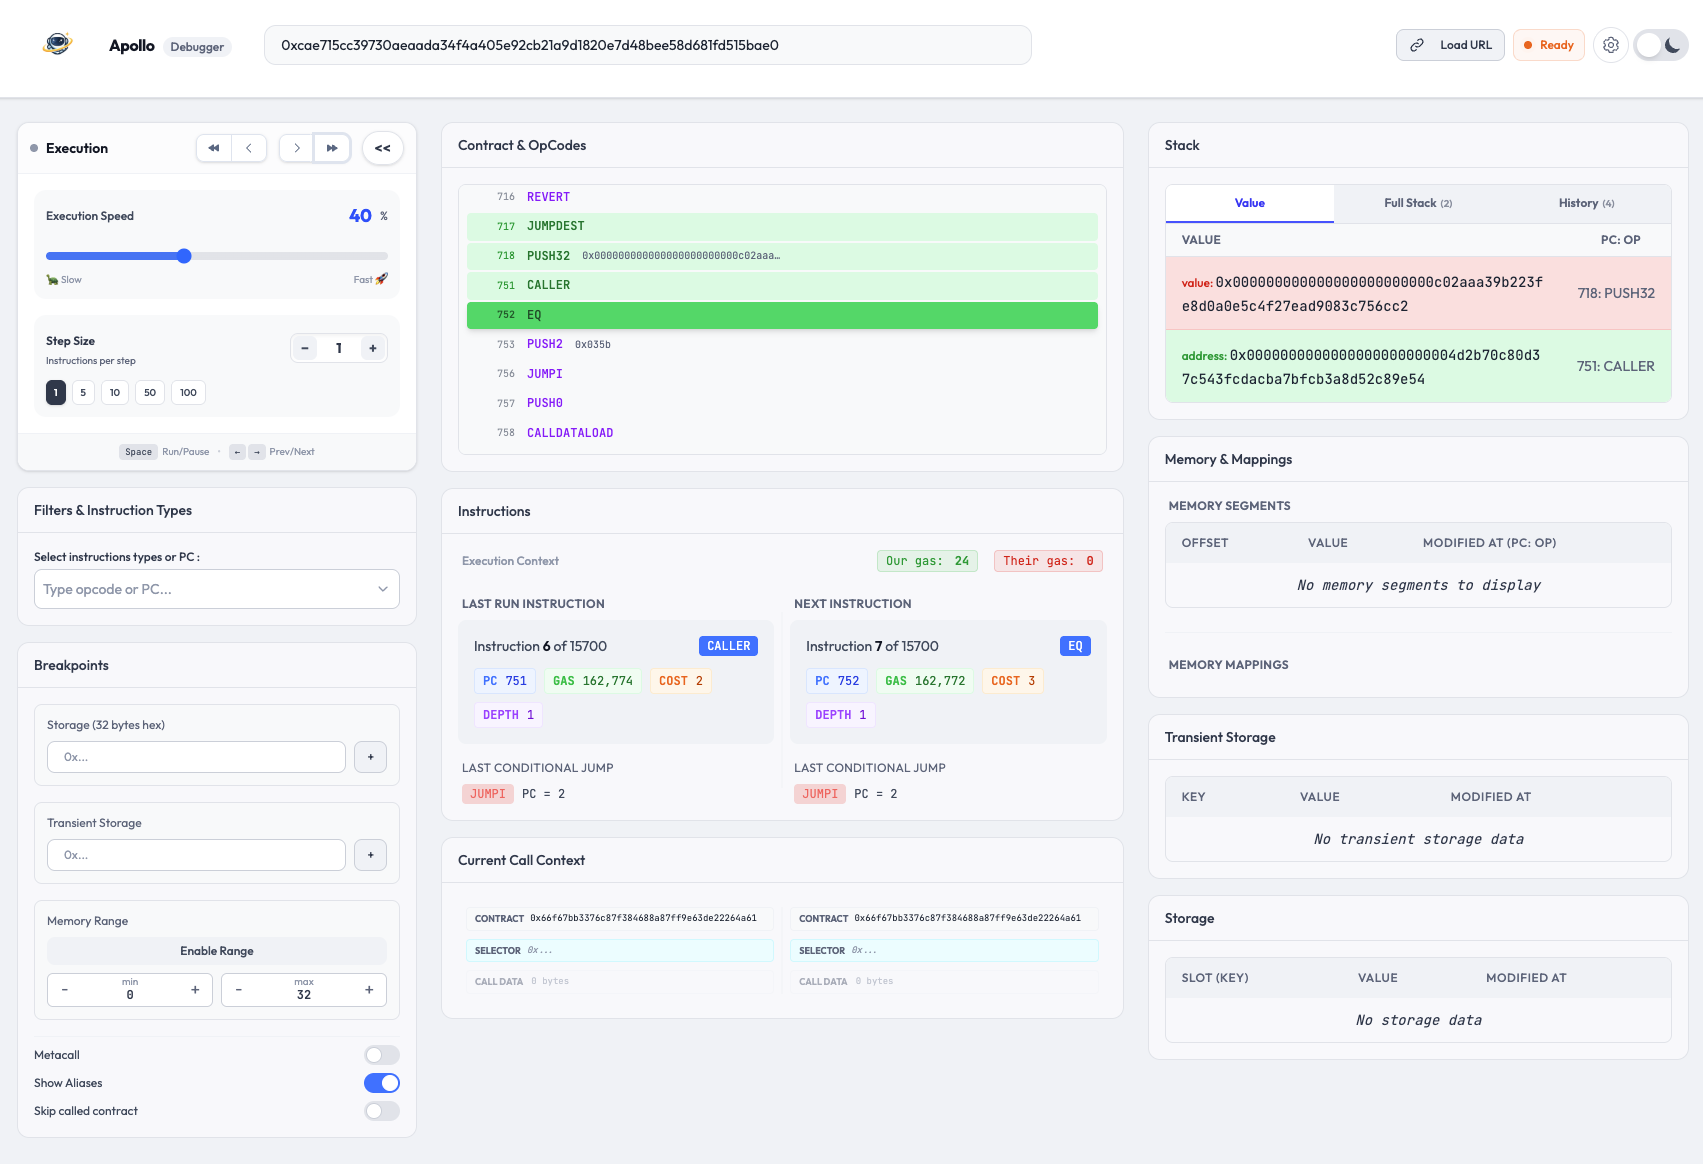
Core Features
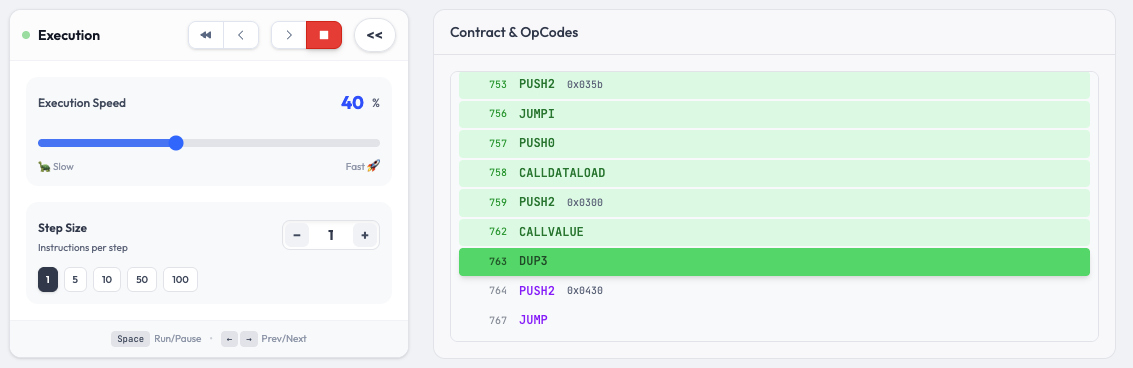
Step-by-Step Execution
Apollo lets you navigate through every single opcode executed during a transaction. You can:
- Move forward and backward through the execution, one instruction at a time or in configurable step sizes.
- Use auto-play with adjustable speed to watch the execution unfold, both forward and backward.
- Use keyboard shortcuts for fast navigation: arrow keys to step, Space to play/pause, and speed controls.
This bidirectional navigation is particularly useful when you reach a REVERT and want to trace back to understand the condition that triggered it.
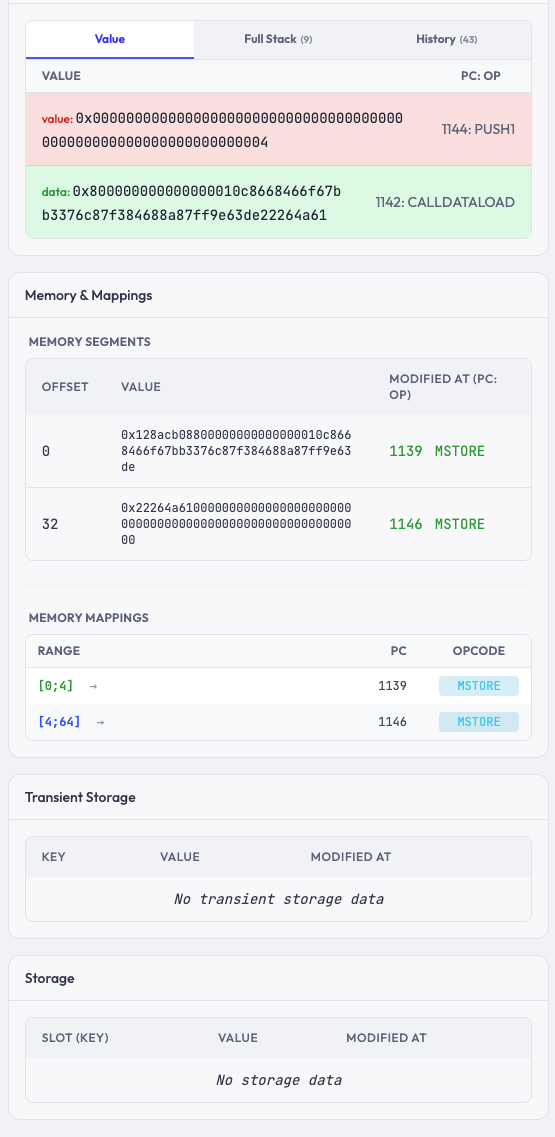
Stack, Memory & Storage Inspection
At each step, Apollo displays the full state of the EVM:
- Stack: see exactly which values are being pushed, popped, and consumed by each opcode. Apollo provides three views: a changes tab showing consumed and produced items color-coded in red and green, a full stack view, and a history tab tracking all modifications step by step.
- Memory: inspect the byte-addressable memory space organized in 32-byte segments, with modification tracking showing which instruction last changed each segment. A dedicated memory mappings view visualizes which opcodes affected which memory ranges.
- Storage: track how contract storage slots evolve throughout the transaction, with highlights for newly written slots and current-step modifications. The same view is available for transient storage (EIP-1153), giving you complete visibility into both persistent and ephemeral state.
Apollo also shows call context information at each step, including the current contract address, function selector, and raw call data, making it easier to follow execution across contract boundaries.
Advanced Breakpoints
Instead of stepping through hundreds of opcodes manually, Apollo supports conditional breakpoints that pause execution when specific conditions are met:
- Storage slot breakpoints: pause when a particular storage slot is written.
- Memory range breakpoints: pause when a specific memory range is written.
- Transient storage breakpoints: pause on transient storage changes (useful for debugging EIP-1153 patterns).
This makes it possible to jump directly to the events you care about without manually stepping through irrelevant instructions.
Gas Profiling
Apollo tracks gas consumption at the instruction level. For each opcode, you can see the gas remaining before execution and the gas cost of the instruction. When a transaction involves sub-calls, Apollo separates your contract's gas usage from gas consumed by called contracts, so you can quickly identify where gas is being spent.
This is invaluable for optimization work. Instead of guessing where gas is being wasted, you get precise data showing which operations are the most expensive.
Contract Viewer
Apollo decodes and displays the bytecode of every contract involved in the transaction:
- Execution highlighting shows which instructions have been executed and which have not, with the current program counter clearly marked.
- Visit counters indicate how many times each instruction was reached, useful for identifying hot loops.
- Cross-contract call tracking automatically follows execution across
CALL, DELEGATECALL, and STATICCALL boundaries, with a clear banner indicating when execution moves to an external contract.
Filters & Aliases
Real-world transactions can be noisy. Apollo gives you tools to focus on what matters:
- Opcode filtering: hide opcodes you are not interested in to reduce visual clutter. A dedicated metacall filter lets you quickly focus on
CALL, STATICCALL, DELEGATECALL, and CREATE instructions. - Address aliases: label any hexadecimal value with human-readable names so you can tell at a glance what a value represents. Aliases are persisted across sessions and displayed throughout the interface.
Use Cases
Debugging a Reverted Transaction
This is the most common use case. A transaction fails on-chain and you need to understand why. With Apollo:
- Paste the transaction hash and the network's RPC URL.
- Apollo reconstructs the trace and positions you at the start of execution.
- Use auto-play to run through the execution, or step manually to the point of failure.
- Trace backward to see the condition check that led to the revert.
- Inspect the stack and storage values at that point to understand the root cause.
What might take an hour of console.log debugging on a local fork takes minutes with Apollo.
Analyzing an Exploit
Security researchers frequently need to dissect exploit transactions after the fact. Apollo is well-suited for this:
- Trace
DELEGATECALL chains to understand proxy manipulation. - Set storage breakpoints to see exactly which storage slots were modified and when.
- Follow reentrancy patterns by watching the call stack across multiple contract invocations.
- Identify flash loan interactions by tracking value flow across contracts.
Optimizing Gas Consumption
Before deploying a contract to production, you want to minimize gas costs. With Apollo's gas profiling:
- Deploy your contract to a testnet and run representative transactions.
- Open those transactions in Apollo and examine the per-instruction gas breakdown.
- Identify redundant
SLOAD operations (storage reads are expensive). - Spot unnecessary memory expansions.
- Compare gas profiles before and after optimization changes.
Learning EVM Internals
Apollo is also a powerful educational tool. If you are learning how the EVM works, there is no better way than watching real transactions execute step by step:
- See how Solidity compiles to opcodes.
- Understand how function selectors work by watching
CALLDATALOAD and comparison operations. - Learn how storage layout works by correlating
SSTORE/SLOAD operations with Solidity state variables. - Observe how the ABI encoding and decoding process works at the opcode level.
Apollo in Practice: A Typical Workflow
Let us walk through a typical debugging session. Suppose you have deployed a token swap contract on Etherlink and a user reports that their swap transaction reverted.
First, open app.apollotrace.com and enter the transaction hash along with the Etherlink RPC endpoint. Apollo fetches the trace and presents the opcode-level execution.
You use auto-play to quickly advance through execution until it reaches the REVERT. Looking at the surrounding opcodes, you see a JUMPI (conditional jump) that was taken, leading to the revert path. Stepping backward, you find an LT (less-than comparison) that compared the user's token balance against the requested swap amount, the user simply did not have enough tokens.
But now you notice something else: the SLOAD that fetched the user's balance was called three times for the same slot. That is three cold storage reads at 2,100 gas each, when a single read cached in a local variable would suffice. You have found both the bug report explanation and a gas optimization opportunity in one debugging session.
Why We Built Apollo
At Functori, we have spent years building tools for blockchain developers and researchers, from Explorus, our protocol consensus explorer, to Argos, our blockchain intelligence platform. As we expanded our work to EVM-compatible chains like Etherlink, we needed a debugger that matched our standards: precise, fast, and usable on any chain without restrictions.
Nothing on the market checked all those boxes, so we built Apollo and made it free for the entire ecosystem. Whether you are a Solidity developer debugging your first contract or a security researcher analyzing a multimillion-dollar exploit, Apollo gives you the visibility you need.
Getting Started
- Go to app.apollotrace.com.
- Enter any transaction hash and the RPC URL of the EVM network it was executed on.
- Start stepping through opcodes.
That is it. No sign-up, no installation, no cost.
We are actively developing Apollo and would love your feedback. If you have feature requests or bug reports, reach out to us at functori.com.