Overview
Explorus is a tool made to keep track, understand, and debug the overall behavior of the consensus and new features of the Tezos blockchain (e.g., optimistic rollups). One of the main strengths of Explorus is that the only requirement is to have a Tezos node, neither an indexer nor a database is required.
Live version
A live instance of Explorus can be found here. It allows you to observe what is happening on different Tezos main and test networks.
Explore your own node
Explorus is a decentralized tool. In fact, you can make Explorus work with any node you want, even your own. All you need to do is specify its RPC address in the settings. Moreover, you can connect it to your sandbox nodes as well.
Onboarding
Here are a few indications of Explorus' features and how to use them.
Navigation bar
The top navigation bar is important to exploit Explorus at its peak. It allows you to navigate different pages, to switch between available networks thanks to the main selector on the right. Next to it, you have a « Tezos clock » that tracks the time and position in the current round. Before diving into the other widgets on the right, let's talk about the convenient sub-bar below that provides information about the current active protocol. Namely, the Tezos Git's commit hash that was used to generate the binaries of the currently running node, the head's hash, the current level, information about when the head was proposed, and when our node did receive it. Finally, we have some information about the current cycle.
 The components of the navigation bar
In the following sections, we will give details on the usage of some useful widgets, linked to the navigation bar.
Consensus progression
We implemented this widget to have a convenient overview of the consensus status. It provides information on whether the consensus is reached (pre/quorum) or not at each level and round. Additionally, it tells you when the quorum was reached and when the last (pre)endorsing operation was received (if there are people that are late). The progression bar is red if the quorum is not reached and green otherwise.
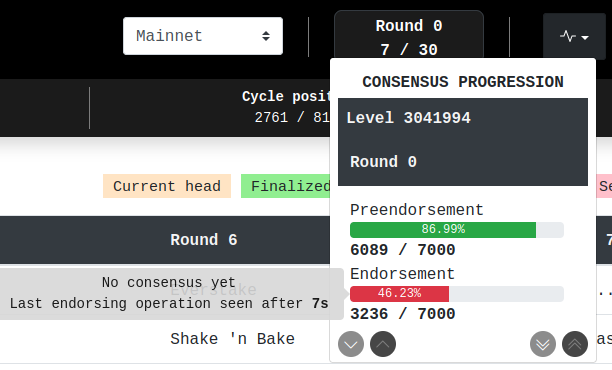 The consensus progression widget
Network constants
From our experiences while debugging either the consensus or a general problem about the network, we know that it is always valuable to have quick access to a few constants, especially the ones related to the round's delay.
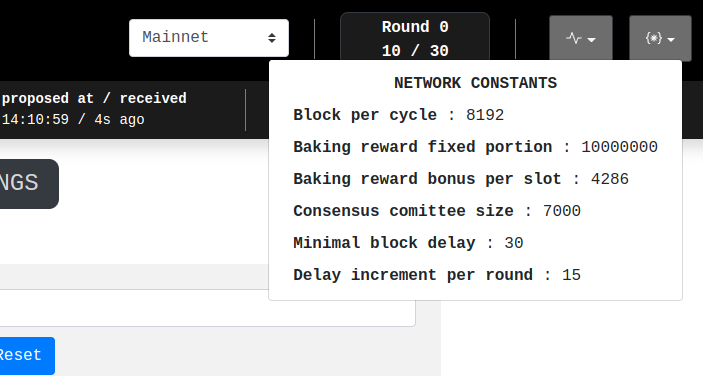 The network constants
Others
If you want to share a specific page with someone, you can always use our copy-url button to generate the appropriate link for you.
When you notice something wrong on Explorus, e.g., the node seems late, it is always worth checking if the whole network is affected by an issue, hence the need for this network-status button.
Explorus is also configurable directly from the app. You can check the possible configurations via the settings button. We'll go into details about it later in this article.
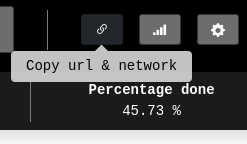
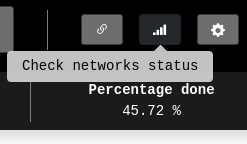
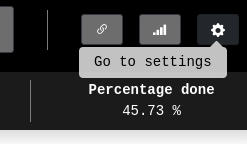 The link copy, networks status, settings buttons
Baking rights
One of the main features of Explorus is the ability to observe the current, future, and past baking rights for a convenient number of levels and rounds, hence the nice view of the current state of the consensus from the bakers' perspective.
Let's dive into more details, shall we?
The current head being proposed will always be beige. If a baker is most likely missing, i.e., he did not endorse his given slot for at least the previous level and round, his cell will be in grey.
Now about the shades of green: a darker green means the block proposed by the baker was indeed proposed, baked, and finalized in the sense of Tenderbake. A lighter green means that the content of the block proposed by the baker is finalized but not the block itself since the current head of the blockchain proposed at level n is not finalized in the sense of Tenderbake. Because of how the parent of this block is chosen (it is based on its fitness1), we can not say that the block at level n-1 is finalized until we progress to the next level, hence the necessity to separate the notion between finalized block and content.
each block, we associate a fitness that determines the quality of the chain leading to that block. This measure is computed by the consensus protocol (Tenderbake). The shell changes the head of the chain to the valid block with the highest fitness. You can get more information about fitness here.
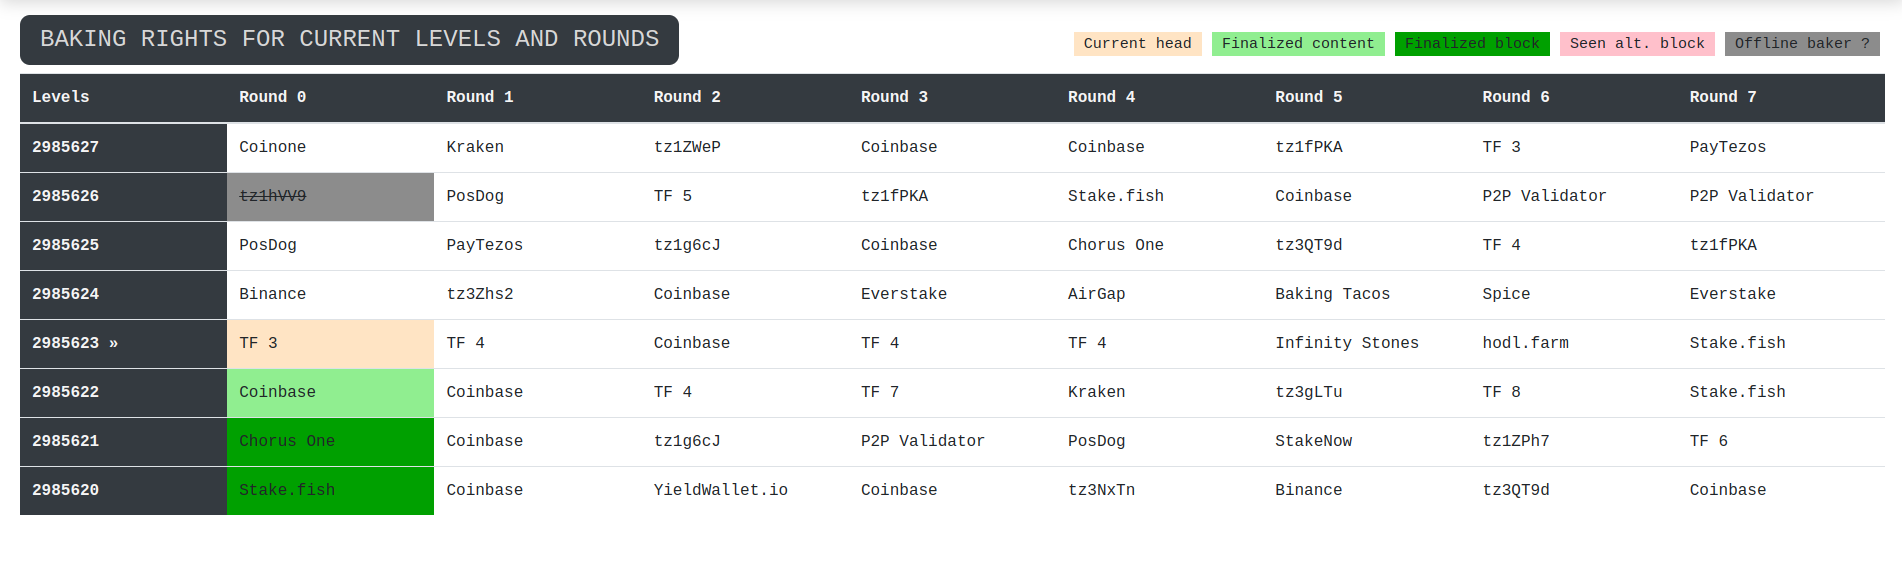 The baking rights table
To get along with the table regarding the baking rights, we would use some information about the latest proposed blocks. That is why you will find the latest blocks table underneath the baking rights table. It provides you with more information about the following:
- when
the block was proposed
- who
proposed and baked the block at level x and round y
- how much
reward did they get
at what percentage was the quorum reached (how healthy the network is)
- how many
endorsement slots were missed during that level and round
- who
was missing at the previous level and round, and how many slots did they miss
finally the fitness (« quality ») associated to the block
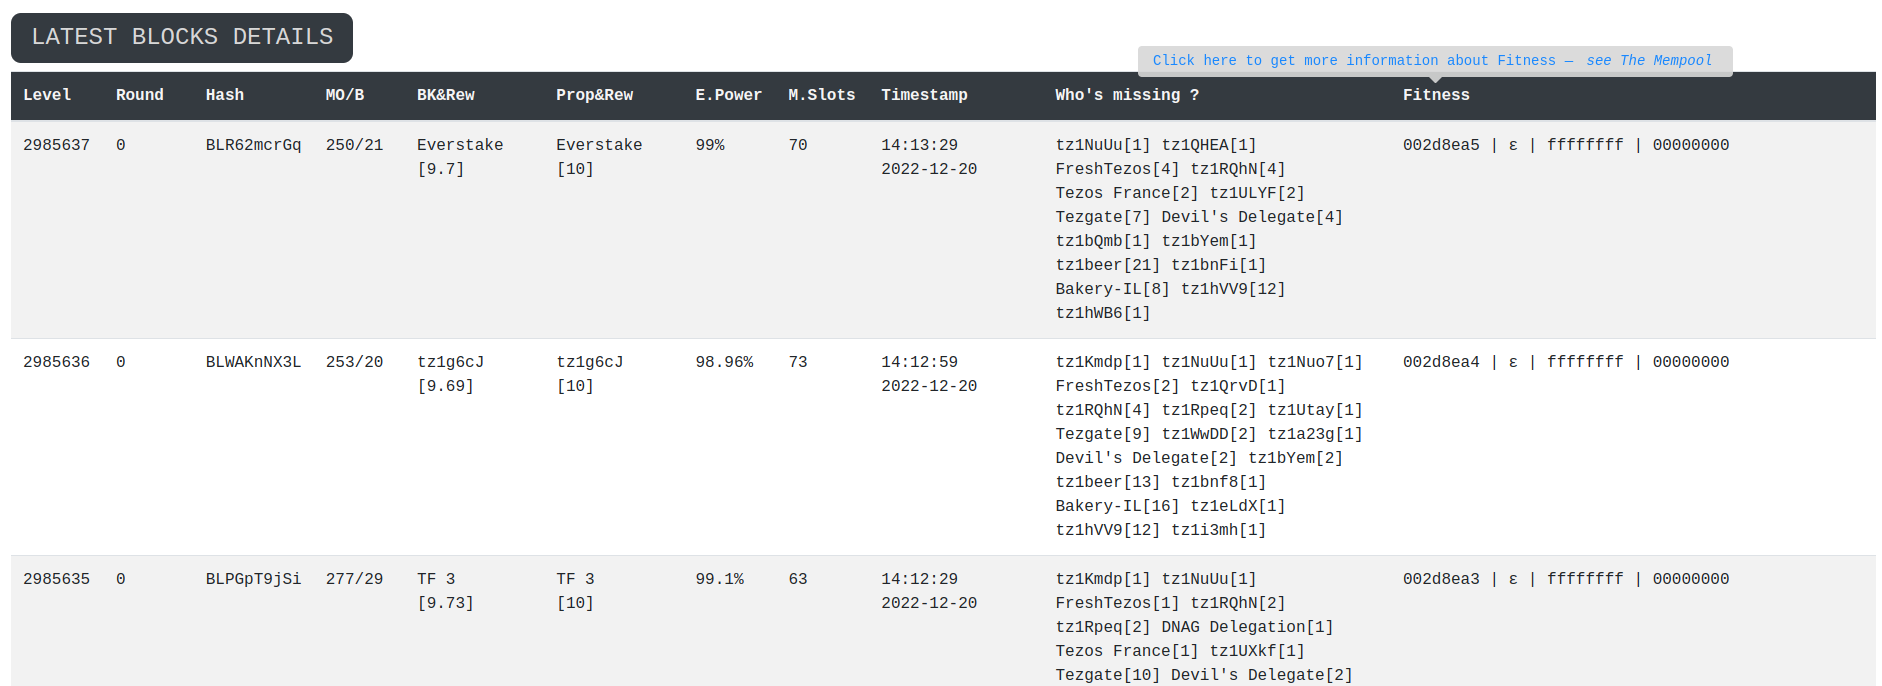 The latest blocks table
Consensus operations
Tracking the Tenderbake consensus in real-time can be a challenging task. For more comfort, Explorus offers a way to observe the approvals of the current block as they are received.
Each baker is linked to the number of slots they own and the approvals they have or have not given to the current block.
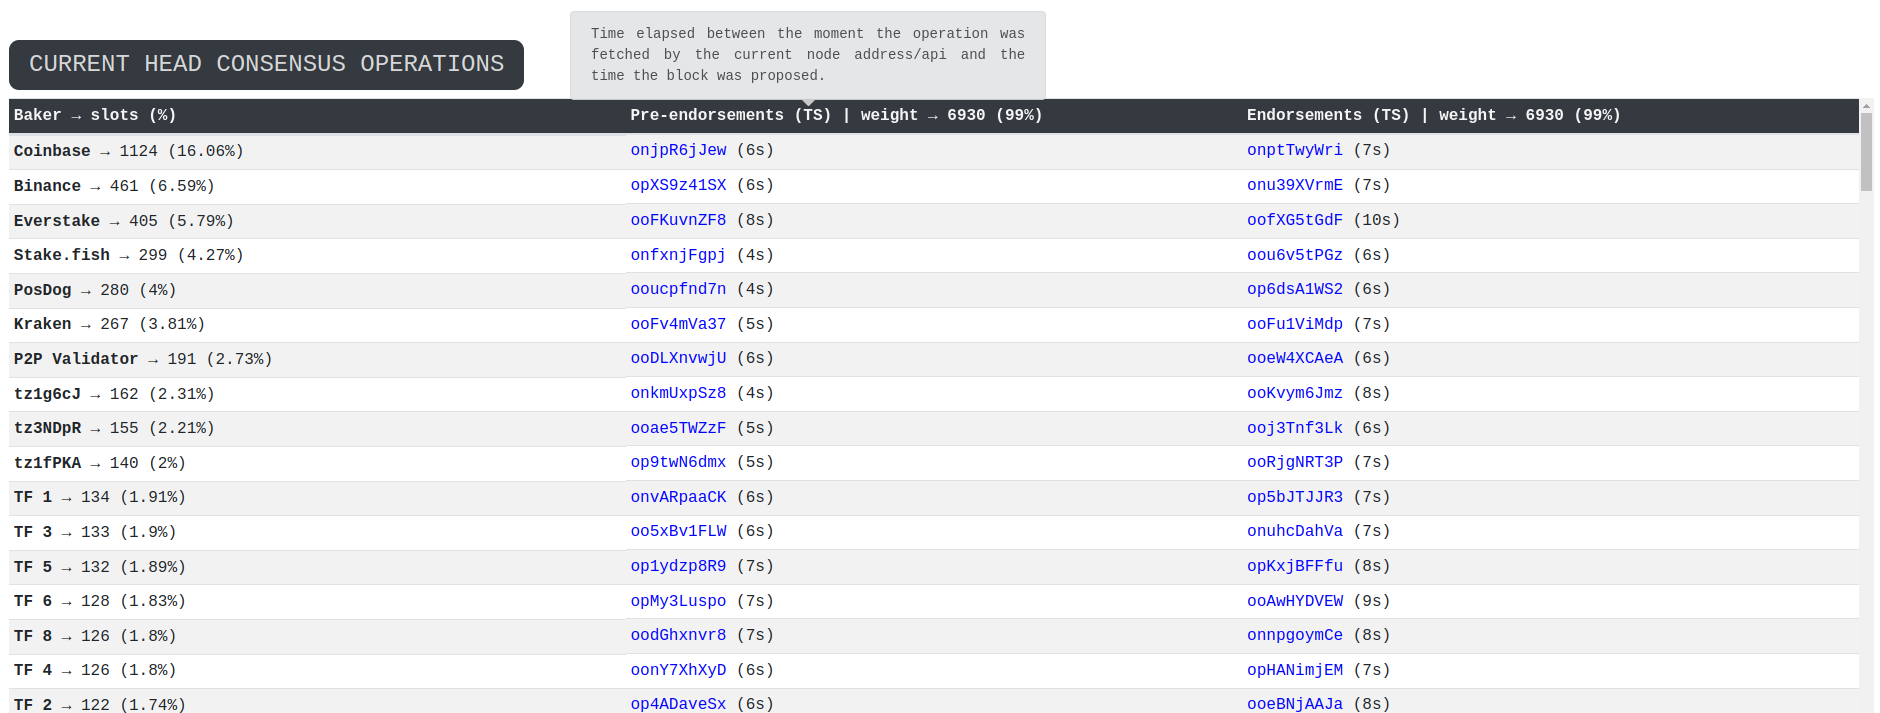 The consensus operations of the current block
Approvals from the last blocks are kept to ensure that the last and late approvals are included.
The ones received late are considered outdated.
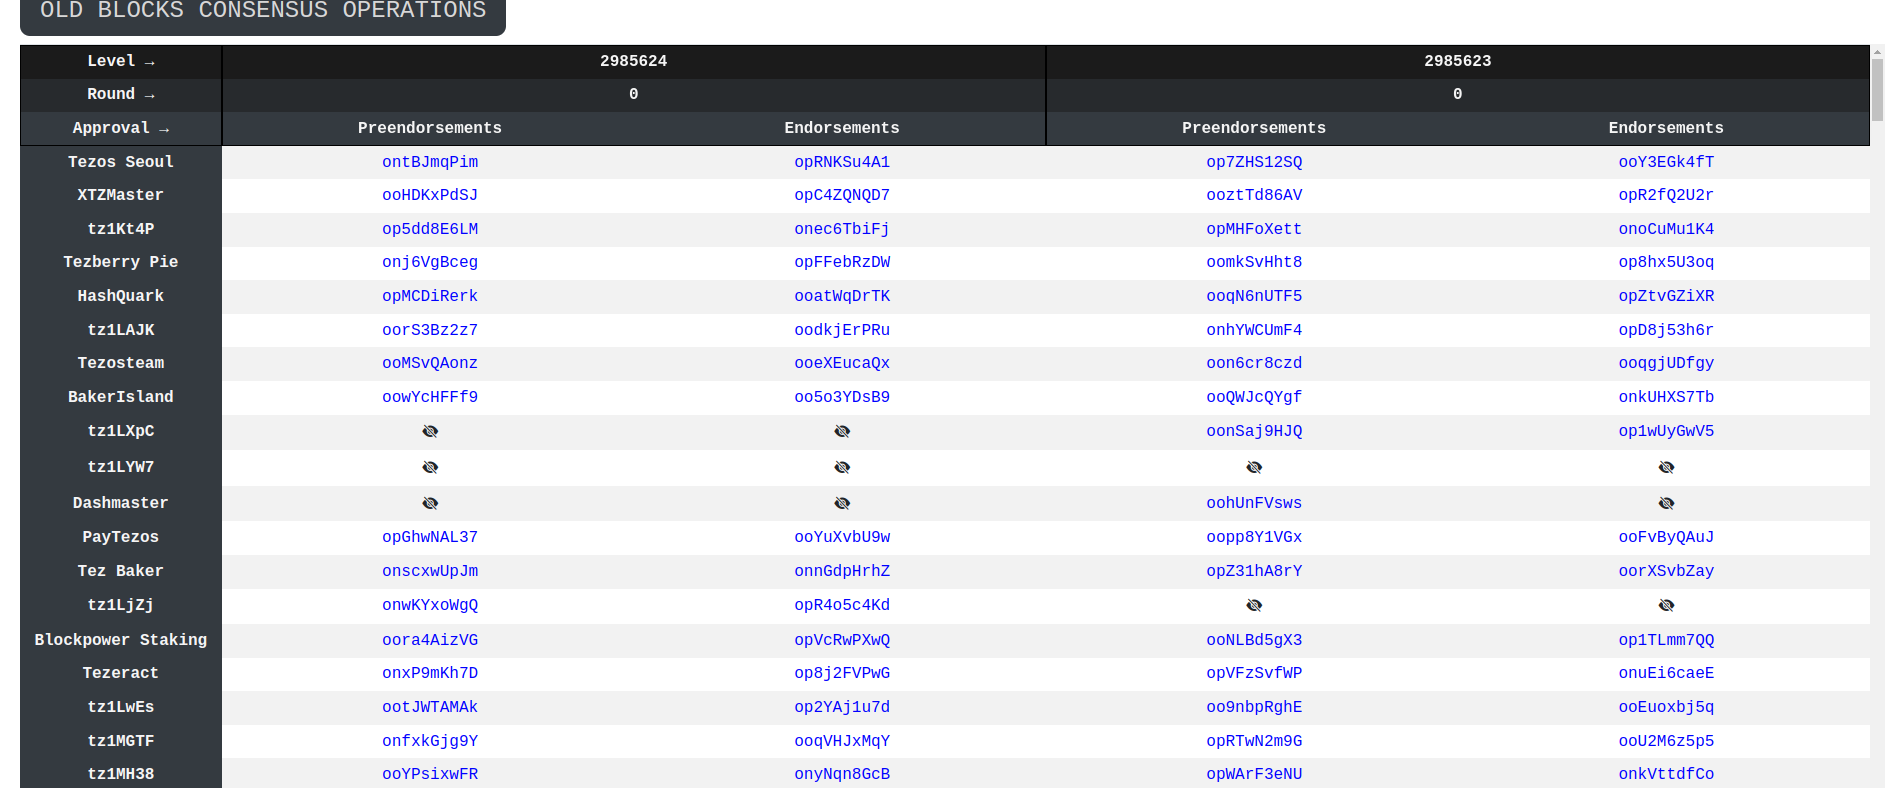 The consensus operations of the latest blocks
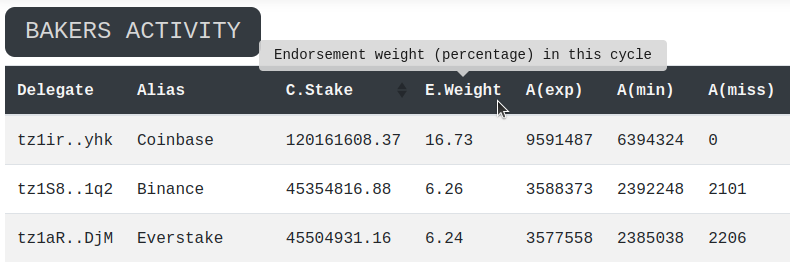
Bakers activity
What is "Proof Of Stake" without its validators?
To keep track of the bakers' activity, we thought of a convenient table to display the most important information amongst them we have:
- Delegate: A 'tz' account registered as a baker.
- Alias: Who's baking with that 'tz' account ([none] means there is currently no known alias for this account).
- C.Stake: Current stake of the delegate (the one that will be snapshotted for rights in future cycles).
- E.Weight: Endorsement weight (percentage) in this cycle. Weight here means their power to get more baking rights during that cycle.
- A(exp): Expected activity (endorsements) i.e., number of attributed slots.
- A(min): Expected minimal activity to get endorsing rewards.
- A(miss): Number of already missed opportunities.
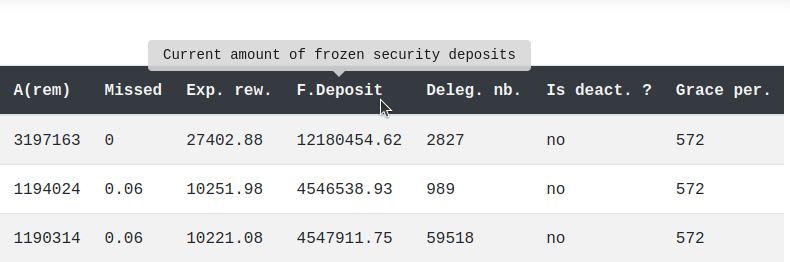
- A(rem): Number of remaining allowed misses before losing rewards.
- Missed: Percentage of missed opportunities (bounded by 1/3).
- Exp. rew.: Expected endorsing rewards at the end of the cycle.
- F.Deposit: Current amount of frozen security deposits.
- Deleg. nb.: Number of delegations to this baker (including him/herself).
- Is deact?: Give information about if the baker is deactivated or not.
- Grace per.: The grace period is the cycle at which the baker will be deactivated if he or she stops participating.
If you have a memory lapse, you can find all those information by putting your mouse over any of these columns' headers to pop out a helpful tooltip.
 The bakers activity table header
Manager operations explorer
It's always labor-saving to have a look at which manager operations (transactions, smart contract calls, ...) were included in which block (hash/level/round), especially in cases where you are setting your own node (maybe in a sandbox), and you are testing multiple scenarios and want to have a quick, readable view of the content of each block passing.
From this tab, you will have access to all those information. Additionally, you can see how many operations were included on the right side (right beside the book icon). Also, you can access the raw content of the operation by clicking on the right side of each operation line. It will open a new tab with the appropriate RPC.
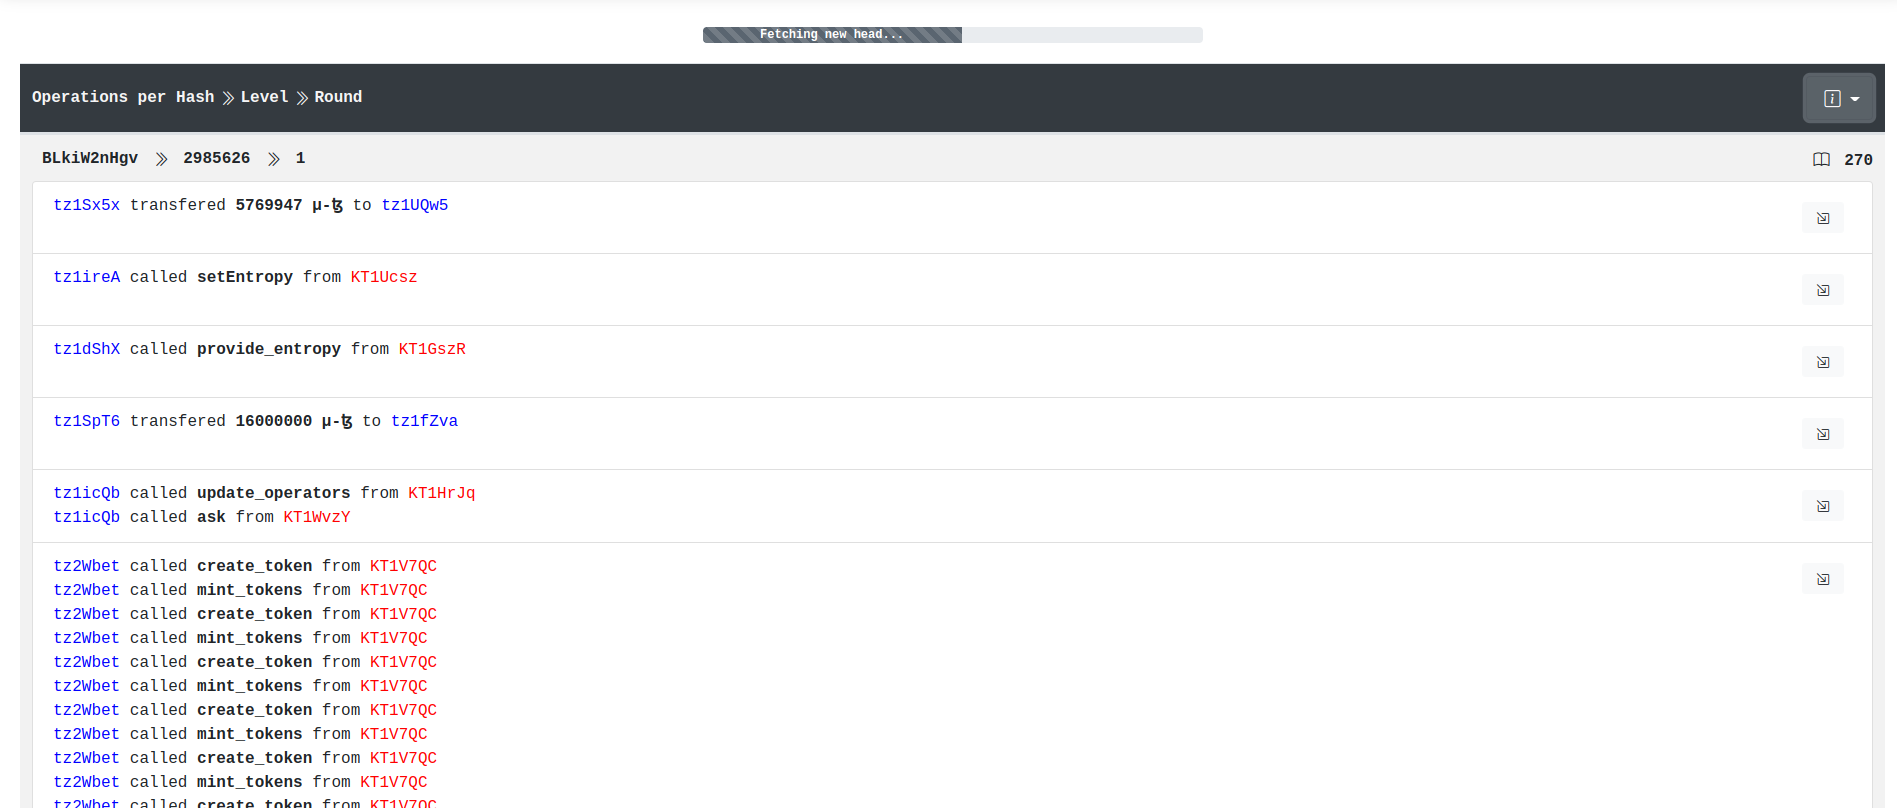 The manager operations page
Settings
From the settings, you can do two things. The first one is setting your custom Tezos API/node address and running it with Explorus. The second one is to choose how you want your hashes to look across the Explorus app.
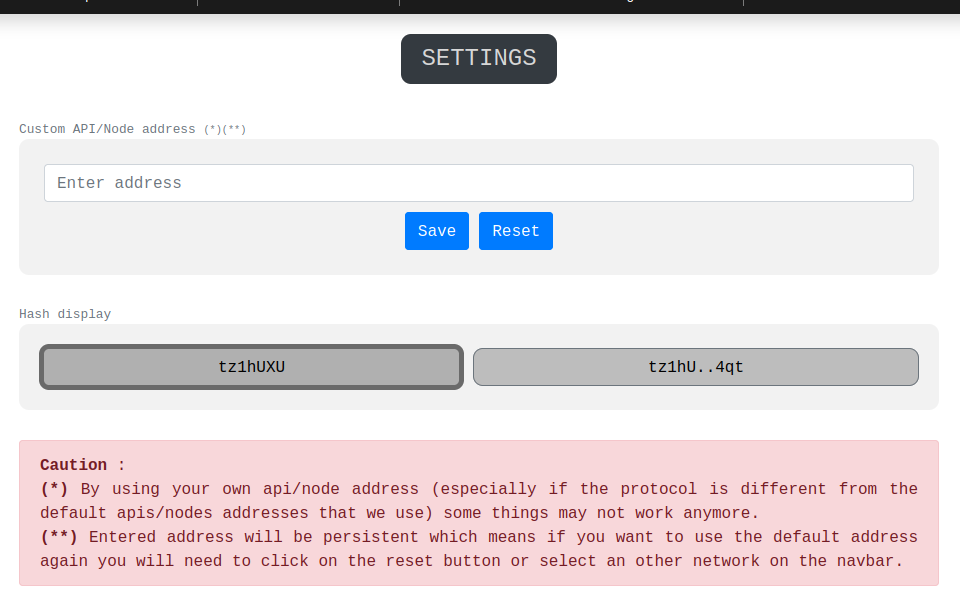 The settings page
Installation
To run an instance of Explorus locally, go to the release section and download (the latest release of) the package explorus.zip.
Once completed, run the following (usually in your download folder):
unzip explorus.zip
cd explorus
Now, you can run your own server. For example:
php -S localhost:8888
or
python3 -m http.server 8888
Finally, visit http://localhost:8888 to start Explorus.
Customisation
Network configuration
There is a configuration file at json/parameters.json that looks like the following:
{
  "mainnet": {
    "addresses": ["https://mainnet.api.tez.ie"]
  }
}
It is the minimal configuration for Explorus to work. Of course, you can add your own API/node addresses instead of those we use.
Explorus is currently compatible with Mainnet, Ghostnet, Limanet,
Mondaynet, and Dailynet, so you can add a section just like for Mainnet in
json/parameters.json.
For example, let's say you want to add a Ghostnet section:
{
  "mainnet": {
    "addresses": ["https://mainnet.api.tez.ie"]
  },
  "ghostnet": {
    "addresses": [
      "https://rpc.ghostnet.teztnets.xyz",
      "https://ghostnet.ecadinfra.com"
    ]
  }
}
You can add multiple addresses for each network. Each additional node address will behave as a backup. If one of the nodes crashes, another one will take
the lead.
Note that Explorus will choose the first address in priority in this list. If this one crashes, it will try the next one, and so on.
By setting the configuration above, when you will open your selector of networks on Explorus, it will display:
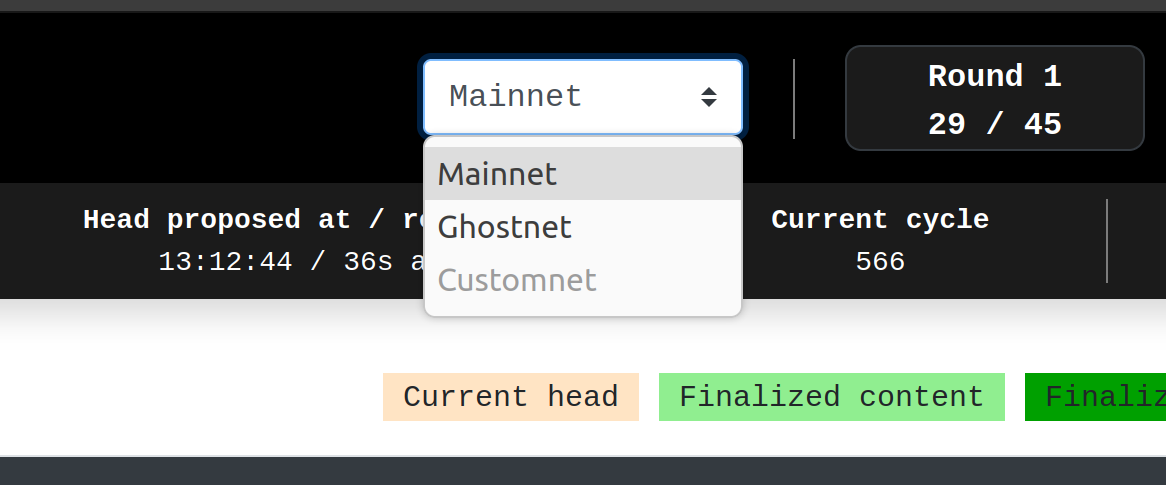 The network selection widget making mainnet and ghostnet available
Note that Customnet is always shaded unless you set your own custom node/API address in the settings.
Components configuration
Explorus has a multi-components architecture. This way, we made it possible to enable or
disable any component that we want, very quickly, directly from json/components_states.json:
{
  "baking_rights": true,
  "round_clock": true,
  "latest_blocks": true,
  "consensus_ops": true,
  "bakers_activity": true,
  "explorer": true,
  "scoru": true,
  "toru": true,
  "info_bar": true,
  "consensus_progression": true,
  "network_constants": true,
  "share_url": true,
  "pyrometer": true,
  "protocol_injection": true,
  "settings": true
}
You just need to put true or false for any of these attributes to enable or disable a
specific component.
With all components:
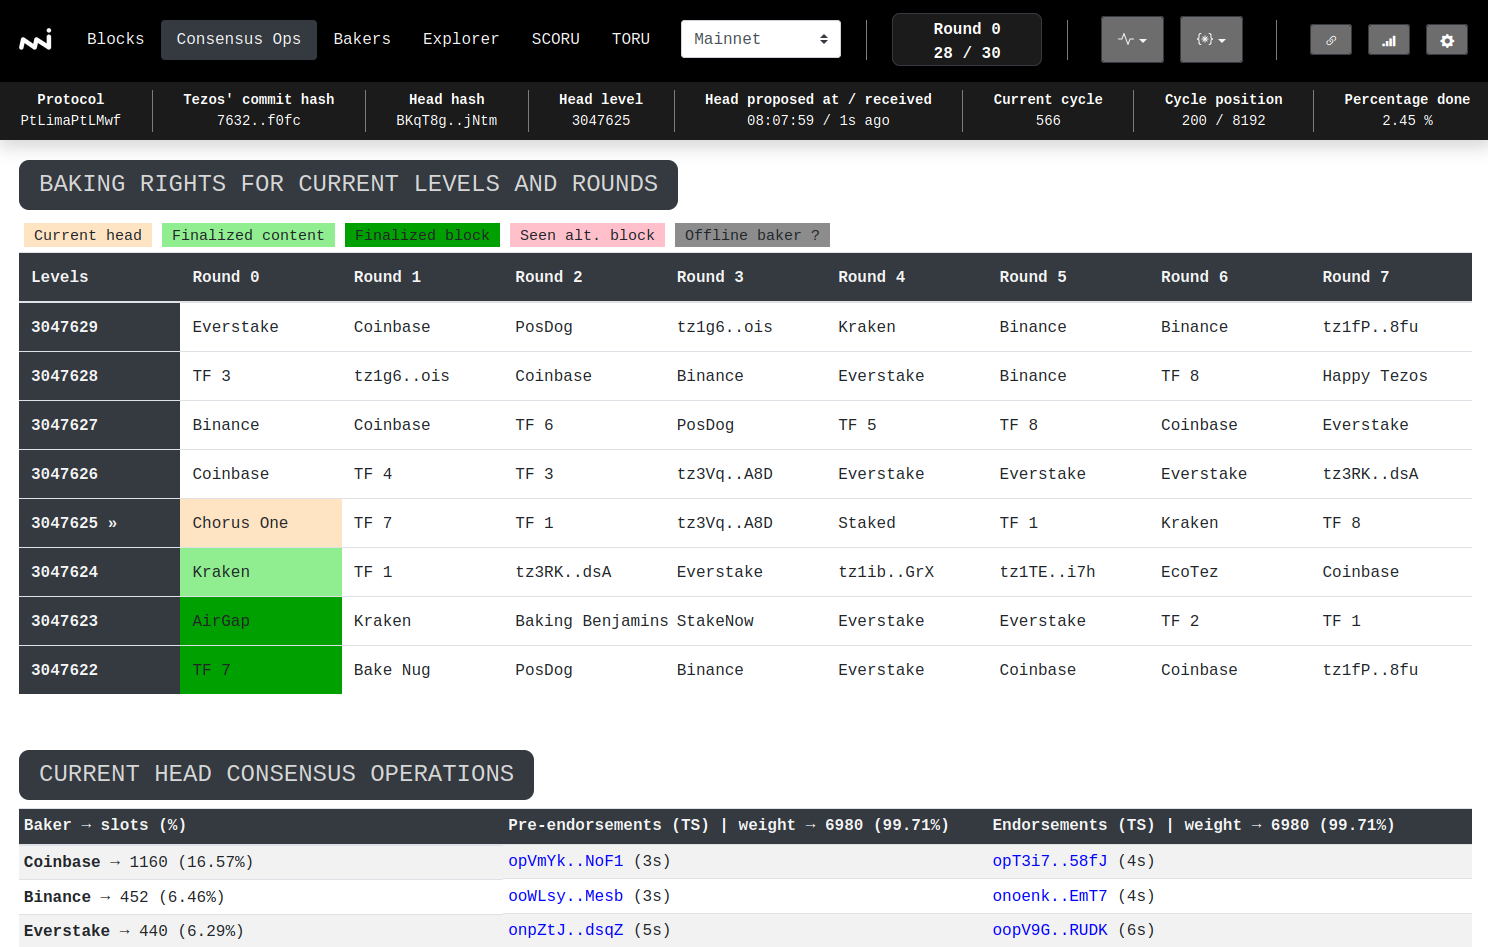 The consensus operations page with all components enabled
Without baking_rights and network_constants:
{
  "baking_rights": false,
  "round_clock": true,
  "latest_blocks": true,
  "consensus_ops": true,
  "bakers_activity": true,
  "explorer": true,
  "scoru": true,
  "toru": true,
  "info_bar": true,
  "consensus_progression": true,
  "network_constants": false,
  "share_url": true,
  "pyrometer": true,
  "protocol_injection": true,
  "settings": true
}
This previous configuration will display Explorus as follow:
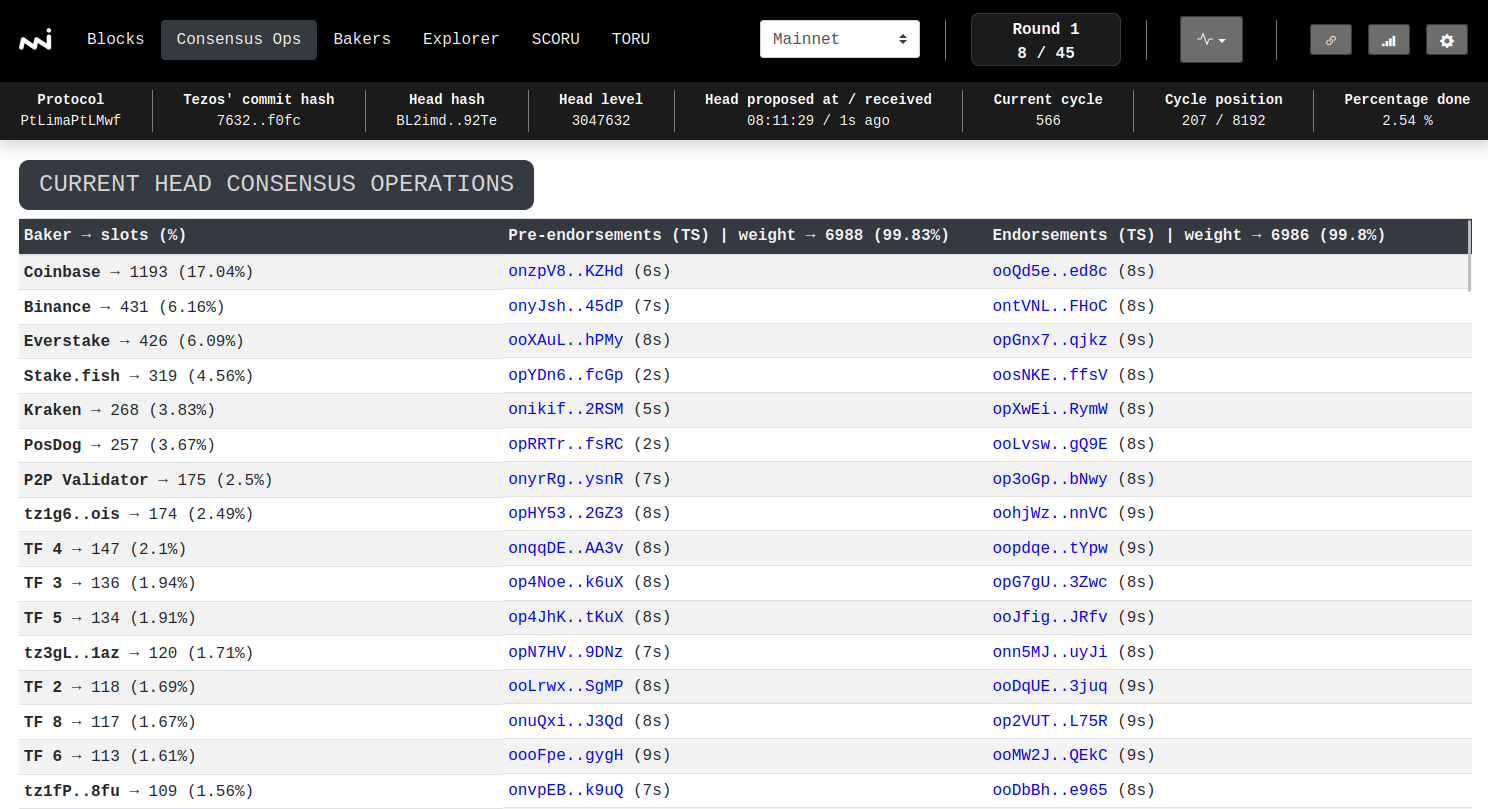 The consensus operations page with baking_right and network_constant components disabled
Sandbox
Explorus also works well with sandbox networks.
Run your sandbox node as you wish. Make sure you run it with --cors-origin "*".
Here is a way to run your own sandbox network using Flextesa:
./scripts/sandbox_node.sh --flextesa_path <flextesa_bin_path> --tezos_path <tezos_dir_absolute_path>
<flextesa_bin_path> is the path to your Flextesa binary and <tezos_dir_absolute_path> is the path to the binary of Tezos.
For example, running a sandbox network on Lima protocol:
./scripts/sandbox_node.sh --flextesa_path . --tezos_path $HOME/tezos --protocol-kind=Lima --base-port=7888
Then go to the Explorus settings and use the custom node localhost:7888.
Note that you can easily get Flextesa under a linux distribution by doing:
./scripts/get-flextesa-for-linux.sh
Contribute with us!
Do not hesitate to give us feedback either through tezos-dev's slack or by opening an issue ticket from our repository explorus/issues. It'd be much appreciated!